
2010 Football World Cup Graphs
A team's strategy in one graph
By Javier López Peña and Hugo Touchette
School of Mathematical Sciences
Queen Mary, University of London
 |
|
Analysis
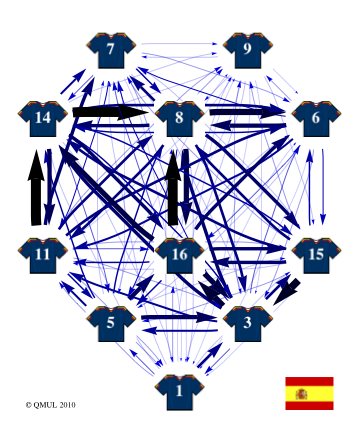
- Centers of the network: Pique (3), Xavi (8), Capdevilla (11), Xabi Alonso (14)
-
Extremely high number of total passes (462). That's more than twice as many as Holland. Clear sign of the distinctive Spanish “tiki-taka” style.
-
Centrality well distributed among all players, resulting in a balanced network as in the German case.
-
Impressive concentration in the midfield, particularly around Busquets (16), Xavi (8) and Xabi Alonso (14). This makes the Spanish strategy quite hard to stop, and explains the unusually high ball possession times of the Spanish squad during most games.
-
Defenders Capdevilla and Ramos are often involved in passes to and from the forwards - a sign they tend to run in order to participate in the attack.
-
Villa, top scorer of the championship, receives an average of 37 passes per game, much more than any forward from any other team.
-
The low-form of Torres is observed in his low participation. With Torres on the pitch, the Spanish attack goes towards Villa. Generally, replacing Torres by another player (like Llorente or Pedro) makes the Spanish attack more balanced.