|
|
 |
|
Player
|
Passes made
|
Passes received
|
Centrality
|
|
1 - David JAMES
|
16
|
12
|
0,0000
|
|
2 - Glen JOHNSON
|
34
|
32
|
0,0056
|
|
3 - Ashley COLE
|
38
|
28
|
0,0056
|
|
4 - Steven GERRARD
|
34
|
46
|
0,0056
|
|
6 - John TERRY
|
41
|
31
|
0,0056
|
|
8 - Frank LAMPARD
|
42
|
42
|
0,0000
|
|
10 - Wayne ROONEY
|
21
|
29
|
0,0056
|
|
14 - Gareth BARRY
|
34
|
36
|
0,0056
|
|
15 - Matt UPSON
|
22
|
19
|
0,0056
|
|
16 - James MILNER
|
15
|
19
|
0,0056
|
|
19 - Jermain DEFOE
|
6
|
9
|
0,0000
|
|
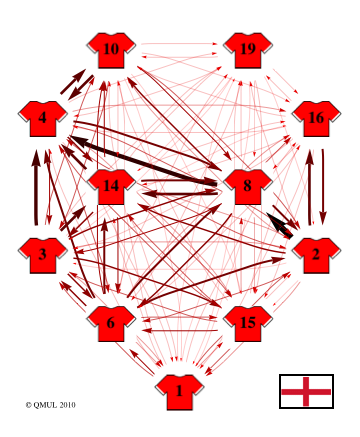
Analysis
- The English squad has
a decent line up from the point of view of network analysis. There
isn't a single player with extremely high centrality,
suggesting a good team playing rather than focusing on individual
players.
- The work at the
midfield, however, doesn't transfer very well to the forwards. The
English attack is heavily loaded on Rooney (10), who receives on
average
three times more passes than Defoe (19). This makes the English attack
very
predictable and easily stoppable by blocking Rooney (10), who is
usually
forced to give the ball back to Gerrard (4).
- There is a
tendency to move the ball towards the left side of the pitch. A high
number of plays start from one of the defenders, often Johnson (2) or
Cole (3),
and try to find Rooney (10) via either Gerrard (4), Lampard (8) or
Barry (14).
- Although Johnson
(2) connects frequently with Milner (16), the latter returns the ball
more often
than passing it to a forward or another midfielder.
- Expected to be the
sensation of the World Cup, Rooney (10) has faced a tough defence
around him
in every single game. As this is not likely to change, England could
clearly benefit from finding different attacking options, either by
giving a
more important role to Defoe (19), or by getting Cole (3) and Johnson
(2) more
involved in the attack.
|