|
|
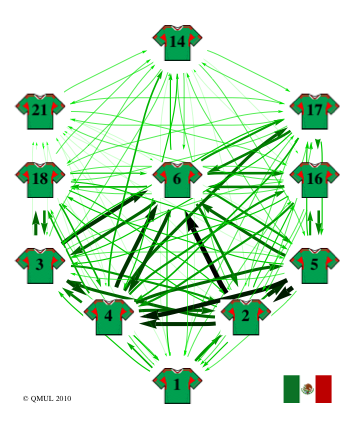
Mexico
Last formation
against Uruguay.
|
|
Player
|
Passes
made
|
Passes
received
|
Centrality
|
|
1
- Oscar PEREZ
|
18
|
9
|
0.0000
|
|
2 - Francisco
RODRIGUEZ
|
40
|
32
|
0.0060
|
|
3
- Carlos SALCIDO
|
31
|
30
|
0.0060
|
|
4 - Rafael MARQUEZ
|
43
|
46
|
0.0060
|
|
5
- Ricardo OSORIO
|
35
|
33
|
0.0060
|
|
6 - Gerardo TORRADO
|
37
|
47
|
0.0060
|
|
14
- Javier HERNANDEZ
|
8
|
11
|
0.0444
|
|
16 - Efrain JUAREZ
|
22
|
23
|
0.0556
|
|
17
- Giovani DOS SANTOS
|
21
|
21
|
0.0615
|
|
18 - Andres GUARDADO
|
17
|
20
|
0.0060
|
|
21
- Adolfo BAUTISTA
|
3
|
3
|
0.0028
|
|
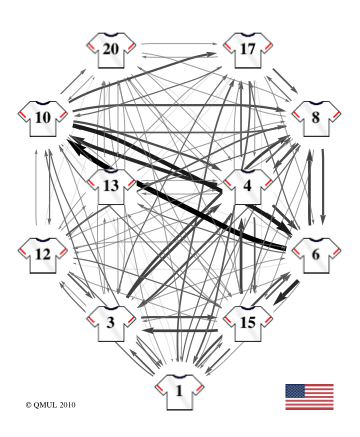
USA
Last
formation
against Ghana.
|
|
Player
|
Passes
made
|
Passes
received
|
Centrality
|
|
1-
Tim HOWARD
|
21
|
14
|
0.0025
|
|
3
- Carlos BOCANEGRA
|
24
|
21
|
0.0080
|
|
4
- Michael BRADLEY
|
29
|
28
|
0.0080
|
|
6
- Steve CHERUNDOLO
|
33
|
27
|
0.0080
|
|
8
- Clint DEMPSEY
|
21
|
29
|
0.0080
|
|
10
- Landon DONOVAN
|
27
|
30
|
0.0080
|
|
12
- Jonathan BORNSTEIN
|
15
|
9
|
0.0056
|
|
13
- Ricardo CLARK
|
6
|
10
|
0.0025
|
|
15
- Jay DeMERIT
|
24
|
22
|
0.0080
|
|
17
- Jozy ALTIDORE
|
11
|
19
|
0.0025
|
|
20
- Robbie FINDLEY
|
8
|
10
|
0.0056
|
|
- Centers of the network:
Carlos BOCANEGRA (3), Michael BRADLEY (4), Clint
DEMPSEY (8), Jay DeMERIT (15)
- Centrality is well
distributed; low number of passes (average of 219 per game). USA may
have a problem with technique rather than tactics.
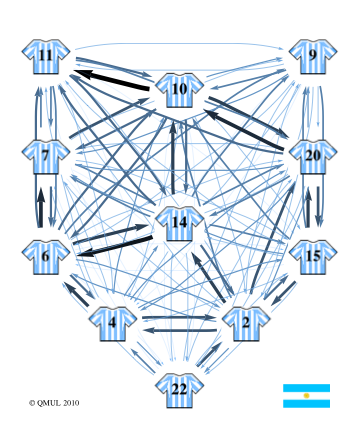
Argentina
Last formation
against Germany.
|
|
Player
|
Passes made
|
Passes received
|
Centrality
|
|
22 - Sergio ROMERO
|
13
|
8
|
0.0049
|
|
2 - Martin DEMICHELIS
|
30
|
26
|
0.0145
|
|
4 - Nicolas BURDISSO
|
23
|
19
|
0.0120
|
|
6 - Gabriel HEINZE
|
31
|
30
|
0.0120
|
|
7 - Angel DI MARIA
|
19
|
25
|
0.0049
|
|
9 - Gonzalo HIGUAIN
|
14
|
17
|
0.0120
|
|
10 - Lionel MESSI
|
32
|
37
|
0.0049
|
|
11 - Carlos TEVEZ
|
20
|
28
|
0.0049
|
|
14 - Javier MASCHERANO
|
36
|
31
|
0.0145
|
|
15 - Nicolas OTAMENDI
|
23
|
20
|
0.0120
|
|
20 - Maxi RODRIGUEZ
|
29
|
29
|
0.0145
|
|
|