
2010 Football World Cup Graphs
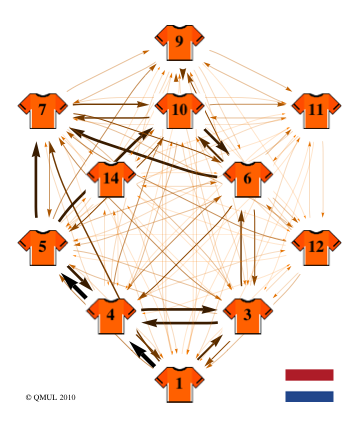
A team's strategy in one graph
By Javier López Peña and Hugo Touchette
School of Mathematical Sciences
Queen Mary, University of London
 |
|
Analysis
- Center of the network: Van Bommel (6)
-
Low number of total passes (229) when compared to Germany (330) or England (303).
- Passes tend to concentrate on the left side of the pitch.
-
Unlike the English or German networks, centrality is concentrated on a few players. This is generally a bad sign, meaning that an effective block of those players will destroy the Dutch game.
-
Kuyt (7) and Sneijder (10) have a very high number of received passes (35 and 33 respectively), in stark contrast with the 12 received by Klose or the 9 by Defoe. On the low end, Robben (11) only gets 11 passes per game.
-
De Zeeuw (14) is the player involved in the lowest number of passes of all the analysed teams. From the point of view of ball circulation, he is completely out of the game.
-
Clear offensive take on the Dutch gameplay, involving a very low number of passes usually aimed at the forwards. This shows the Dutch preference for quick attacks and counterstrikes rather than intricate playing.